


ABA Data Reveals Minority Students Are Disproportionately Represented in Attrition Figures
Recently, AccessLex added new ABA non-transfer attrition data disaggregated by race and ethnicity to Analytix by AccessLex. Non-transfer attrition refers to students who discontinue their legal education for any reason other than transfer to another law school. Previous ABA data reports show that non-transfer attrition often occurs for academic reasons, but can also result from financial and other circumstantial challenges. The ability to evaluate 1L non-transfer attrition data by race and ethnicity is a significant development, enabling a more nuanced analysis of non-completion among law students (NOTE: The following analysis does not include the three ABA-approved law schools in Puerto Rico.)
The new data reveal that historically underrepresented law students—those identifying as American Indian, Asian, Black, Hispanic, Native Hawaiian, and two or more races—are disproportionately represented among students who do not persist beyond the first year. In 2016, white students comprised 62 percent of 1L enrollment and 49 percent of 1L non-transfer attrition. In contrast, minority students made up 30 percent of 1L enrollment but accounted for 44 percent of 1L non-transfer attrition. This disproportionate representation of minority students among those who did not advance to the second year of law school is largely driven by the overrepresentation of Hispanic and black students in 1L non-transfer attrition figures (Figure 1).
Figure 1: Percent of 1L Enrollment vs. Percent of 1L Non-Transfer Attrition, 2016-17
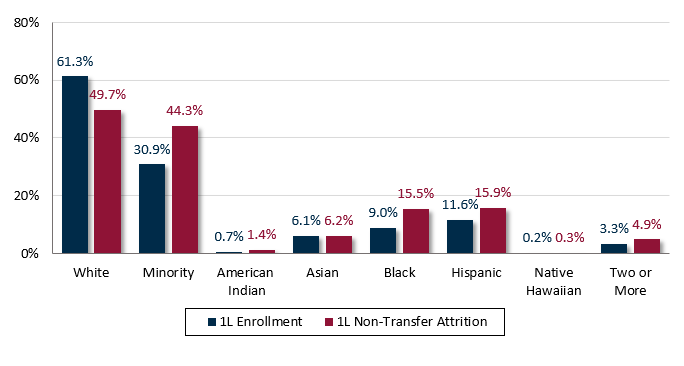
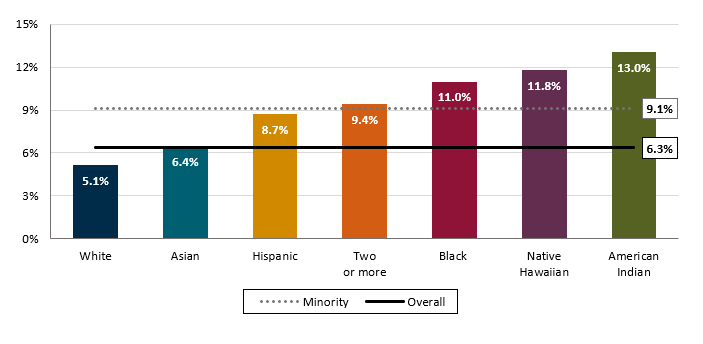
Comparing 1L non-transfer attrition rates further demonstrates these proportional disparities. In 2016, the 1L non-transfer attrition rate of white students was 5 percent, but was 9 percent for minority students. In the same year, the 1L non-transfer attrition rate was nearly 9 percent for Hispanic law students and 11 percent for black students. However, 1L non-transfer attrition rates were highest for American Indian and Native Hawaiian students (Figure 2).
Figure 2: 1L Non-Transfer Attrition Rates at ABA-approved law schools, 2016-17
These trends hold across all ABA-approved law schools, regardless of school sector or median LSAT score of first-year students. In 2016, minority students represented roughly 30 percent of 1L enrollment at both public and private law schools, but comprised roughly 41 percent and 45 percent of 1L non-transfer attrition at public and private schools, respectively (Table 1).
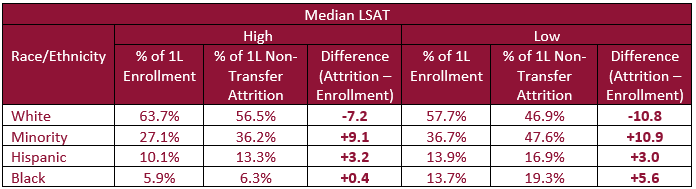
Minority students are also overly represented in 1L non-transfer attrition at both high LSAT law schools (those with median LSAT scores at or above the median of all law schools) and low LSAT schools (those with median LSAT scores below the median of all law schools) (Table 2).
Although gaps between first-year minority enrollment and non-transfer attrition persist across schools, the magnitude of these differences varies by minority group. For example, the gap between black 1L enrollment and 1L non-transfer attrition is higher at public and low LSAT law schools than at private and high LSAT law schools (Tables 1 and 2).
Table 1: Percent of 1L Enrollment vs. Percent of 1L Non-Transfer Attrition by School Sector, 2016-17
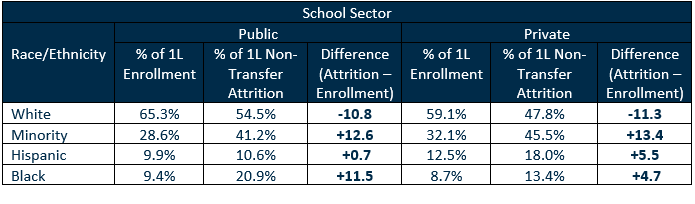
Table 2: Percent of 1L Enrollment vs. Percent of 1L Non-Transfer Attrition by Median LSAT, 2016-17
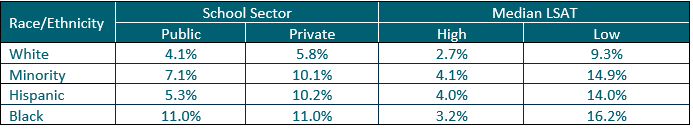
These trends are also observed when comparing 1L non-transfer attrition rates by race and ethnicity across law school types. In 2016, the minority 1L non-transfer attrition rate was 7 percent at public schools and 10 percent at private law schools, while the white 1L non-transfer attrition rate was 4 percent and 6 percent at public schools and private schools, respectively (Table 3).
Minority students also have higher non-transfer attrition rates at both low and high LSAT schools. In 2016, the 1L non-transfer attrition rate of minority students at high LSAT schools was 4 percent compared to 3 percent for their white peers. Similarly, the 1L non-transfer attrition rate of minority students at low LSAT schools was nearly 15 percent compared to 9 percent for white students (Table 3).
Table 3: 1L Non-Transfer Attrition Rates of ABA-approved law schools, by School Sector and Median LSAT, 2016-17
Racial and ethnic disparities in law school admission and enrollment have been well-documented. The extension of these disparities to law school persistence highlights the need for further exploration of the roadblocks minority students face in the first year of law school and the academic support mechanisms offered to overcome them. Law school administrators should evaluate the characteristics of students who leave to better identify and support those who struggle for academic or other reasons. Leveraging campus surveys such as the Law School Survey of Student Engagement (LSSSE) can also help schools investigate challenges minority students experience compared to white students who are more likely to persist.
Further, law schools should strive to regularly assess and enhance their curricula to ensure they are providing inclusive environments where all students can thrive. Some scholars suggest that accounting for culturally diverse viewpoints when teaching and discussing the law can increase academic engagement and sense of belonging among minority law students, 1which can, in turn, encourage enhanced and deeper understanding of the law for all students.
To review and compare attrition data by law school, visit Analytix by AccessLex.
To learn more about our academic and bar success initiatives, visit AccessLex.org.
1See Feingold, J. and Souza, D. (2013). Measuring the racial unevenness of law school. Berkeley Journal of African-American Law & Policy, 15(1), 71-116; and Johnson, K. R. (2011). The importance of student and faculty diversity in law schools: One dean’s perspective. Iowa Law Review, 96, 1549-1577.